The problem
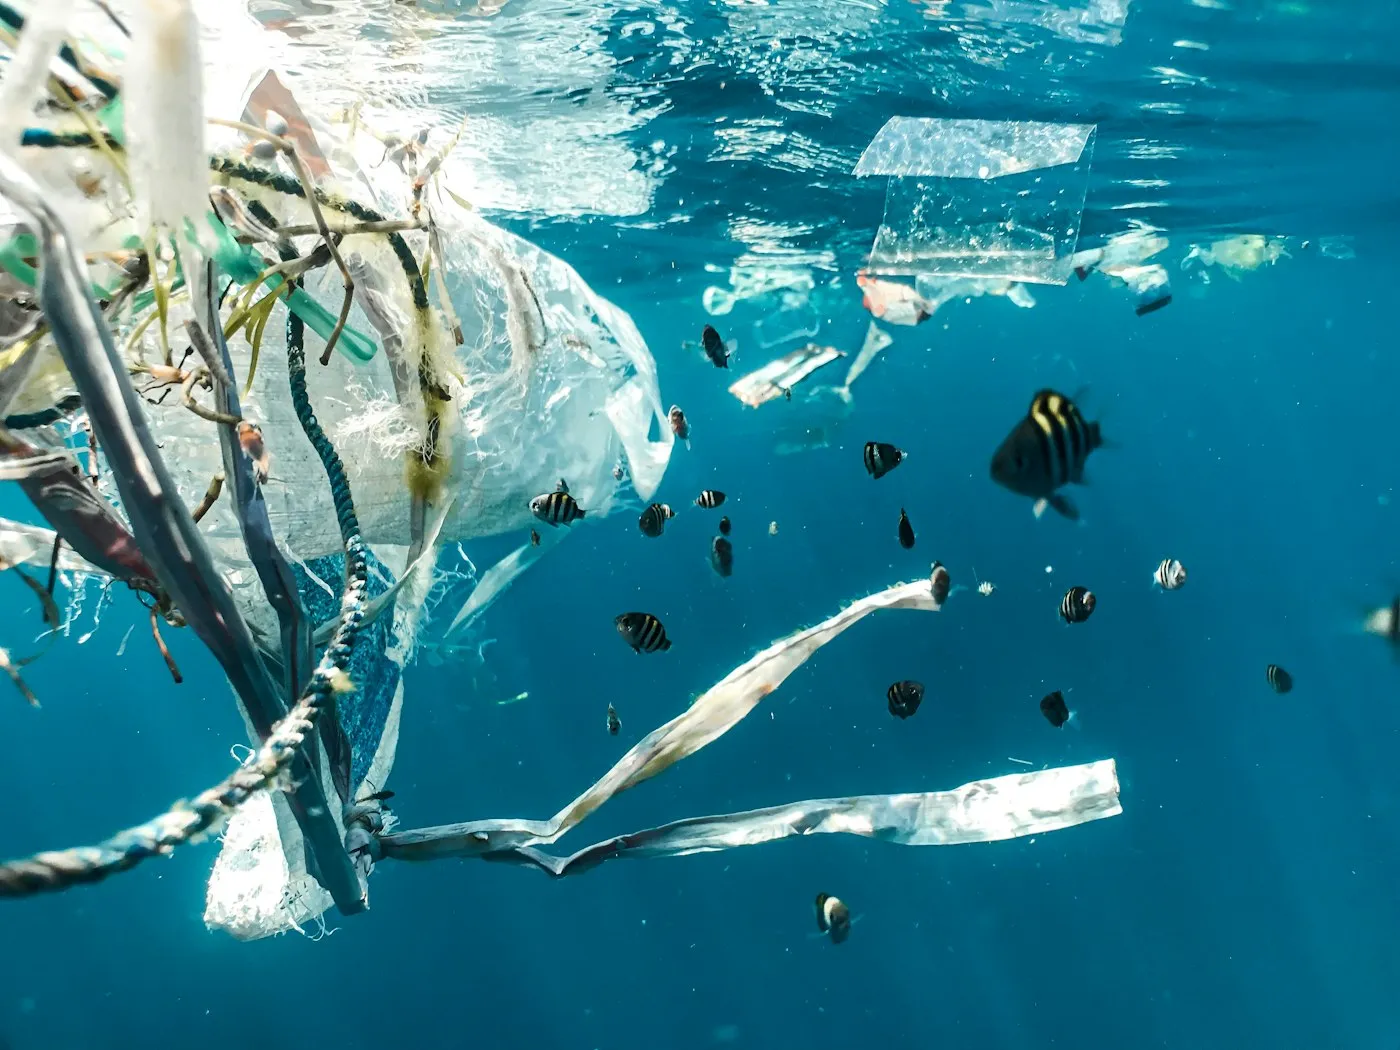
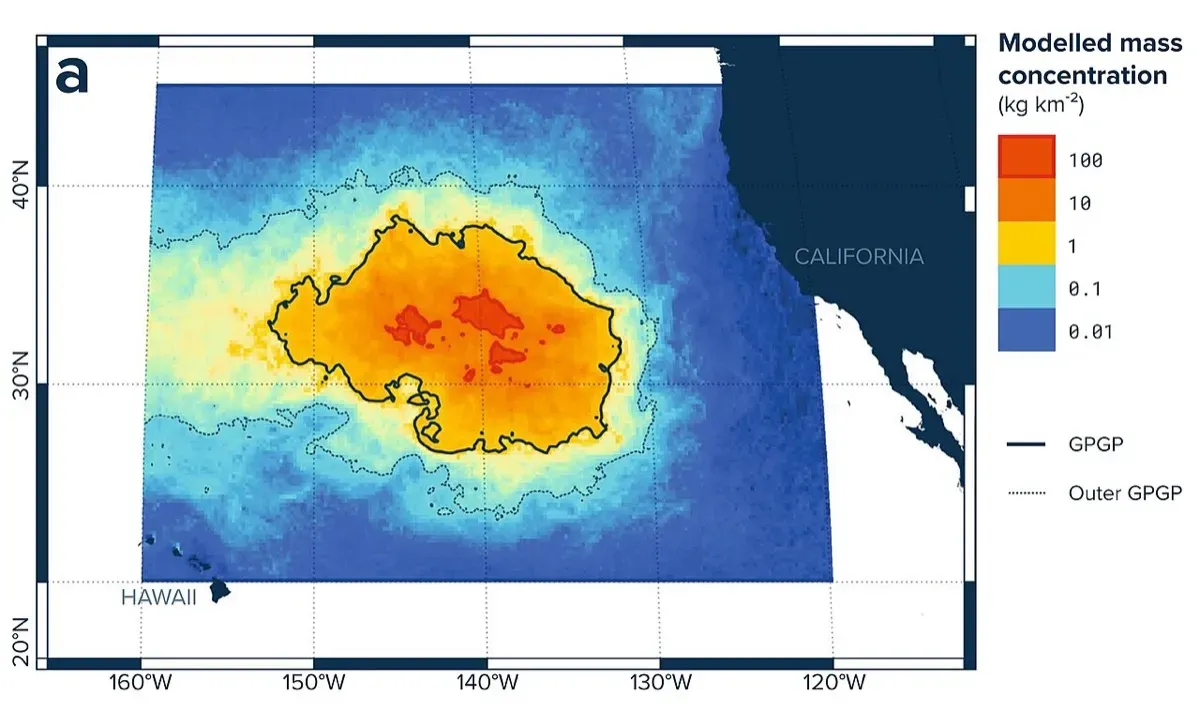
Five subtropical gyres trap floating debris far from any coast. The best known, the Great Pacific Garbage Patch (GPGP), was estimated from surveys in 2015 and 2016 to hold between 45,000 and 129,000 tonnes of floating plastic over about 1.6 million km² (Lebreton et al., 2018). Much of the mass is large debris such as fishing nets, crates and ropes, which slowly breaks down into microplastics.
Unlike coastal litter, which tides and beach cleanups can reach, gyre plastic will not wash ashore on its own. It harms marine life by entanglement and ingestion, carries invasive species and pollutants, and keeps shedding fragments for decades. The Ocean Cleanup’s own modelling estimates that about 80% of plastic mass in this patch comes from fishing and aquaculture rather than land (Sainte-Rose et al., 2026), so prevention on land alone will not remove what is already there.
The product
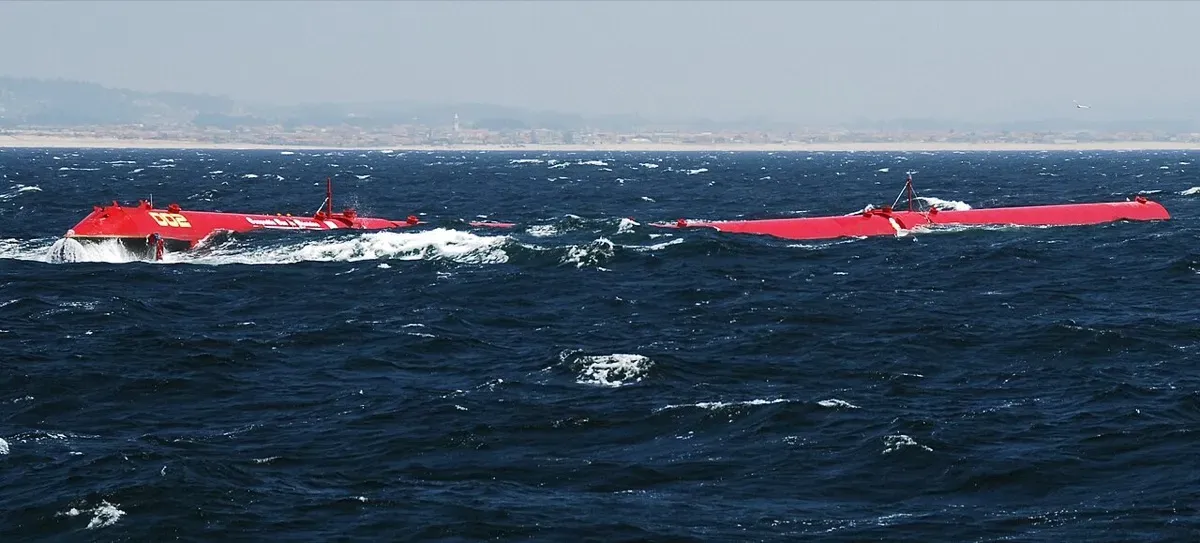
System 03 is the third generation of The Ocean Cleanup’s offshore technology. Earlier passive designs drifting with the current, tested in 2018 and 2019, collected only 7,173 kg. The organisation switched to an actively towed system: two ships pull a long floating barrier in a wide U shape, and the current created by the slow tow guides plastic into a retention zone at the apex.
At about 2.2 km, System 03 is nearly three times longer than System 002 and, according to the organisation, can clean an area the size of a football field every five seconds (The Ocean Cleanup). Its first deployment in the GPGP began in late August 2023.
How it works
The barrier is made of floating units with a screen hanging beneath the surface, about 4 m deep, which stops floating plastic while letting water and most marine life pass under it. The retention zone at the back uses a net with mesh between 1 and 1.6 cm. Periodically, the crew closes the zone and lifts the catch on deck, where plastic larger than 5 cm is sorted into fibrous material, such as nets and ropes, and rigid items before weighing (Sainte-Rose et al., 2026).
Environmental safeguards are built in: acoustic pingers and green LED lights warn animals, the retention zone has exit routes for animals, such as large gaps in its bottom section, towing is slow, and observers watch above and below the water. Across 72 analysed collection periods, bycatch was a small fraction of plastic mass, with a median ratio of 0.58%. Collected plastic is tracked and certified for recycling into durable products.
Timeline
| Date | Milestone |
|---|---|
| 2013 | The Ocean Cleanup founded by Boyan Slat |
| 2018 to 2019 | System 001 and 001B, passive drifting systems, collect 7,173 kg |
| August 2021 | Towed System 002 begins extraction in the GPGP |
| Late August 2023 | System 03 begins its first deployment |
| 6 September 2024 | Organisation states the GPGP can be cleaned in ten years for US$7.5 billion at current performance |
| November 2024 | End of 2021 to 2024 campaign: 497,656 kg removed in 23 missions |
| 2025 | Planned pause in extraction for hotspot mapping and upgrades; peer-reviewed environmental benefit assessment published |
| 20 March 2026 | Scientific Reports paper models an 80% cleanup between 2027 and 2037 |
| 2026 | AI-assisted Smart Steering Strategy due for its first test in the GPGP |
Impact and numbers
- Removed: 504,229 kg of plastic over 1.5 cm from the North Pacific by the end of 2024, including 497,656 kg from System 002 and System 03.
- Performance: System 03 achieved an average retention efficiency of about 40% of the plastic crossing its span, and a median system uptime of about 70% during 2021 to 2024 operations.
- Feasibility: with 15 systems for 10 years at today’s performance, more than 80% of the patch’s plastic mass could be removed for about €5.3 billion; with 70% retention and optimised steering, the cost could fall to €1.8 billion (Scientific Reports, 2026).
- Net benefit: a 2025 assessment with 15 independent scientists concluded that the benefits of cleanup outweigh impacts such as bycatch and vessel emissions (Egger et al., 2025).
Honest caveats. Half a million kilograms is significant work but still a small share of the patch; the 2024 announcement put it at about 0.5% of the total accumulated trash. Towing ships burn fuel, and offshore extraction is expensive per kilogram compared with river interception. The feasibility paper was written by Ocean Cleanup staff, and its authors note that retention efficiency may be overestimated and that tests did not cover high-wind conditions. Without cutting new inflows, especially lost fishing gear, the patch would refill.
What’s next
2025 was a year of consolidation. Basin tests at the Maritime Research Institute Netherlands (MARIN) in Wageningen studied how plastic slips under or over the barrier, and a Smart Steering Strategy combining drones, a ship-mounted AI camera called ADIS and real-time plastic density models was developed with Amazon Web Services to steer systems through the densest hotspots (Annual Report 2025). The 2026 paper compared random steering, short-sighted hotspot hunting and an optimised strategy, and found steering significantly affects how much plastic a fleet recovers; only the optimised strategy reached the 80% goal in every modelled case. Better steering, together with raising retention efficiency from about 40% to at least 70%, is what would bring the cost down toward €1.8 billion. Testing in the patch is scheduled for 2026, ahead of a possible scaled fleet from 2027.
Why it matters for Europe / green buyers
System 03 is a Dutch-engineered, Europe-based answer to a global commons problem. The EU’s Zero Pollution Action Plan targets a 50% reduction in plastic litter at sea by 2030 (European Commission), but that goal is about stopping new inputs. Legacy plastic in the gyres sits outside any national jurisdiction and needs funded, verifiable cleanup.
For companies considering support, the useful questions are measurable: kilograms removed and certified, cost per kilogram, bycatch data, vessel emissions and independent review. The Ocean Cleanup now publishes most of these. Funding cleanup should complement, not replace, cutting plastic production, waste and lost fishing gear.
Sources & image credits
- B. Sainte-Rose, L. Lebreton, Y. Pham, A. Tjallema and C. Maes, “Modelling the cleanup of the North Pacific Garbage Patch based on 3 years of operational experience”, Scientific Reports, 20 March 2026: https://link.springer.com/article/10.1038/s41598-026-40859-y
- The Ocean Cleanup, “The Great Pacific Garbage Patch can be cleaned for $7.5 billion”, press release, 6 September 2024: https://theoceancleanup.com/press/press-releases/the-great-pacific-garbage-patch-can-be-cleaned-for-7-5-billion/
- The Ocean Cleanup, Annual Report 2025, published 2026: https://assets.theoceancleanup.com/app/uploads/2026/09/The-Ocean-Cleanup_Annual-Report-2025.pdf
- The Ocean Cleanup, “System 03: A Beginner’s Guide”: https://theoceancleanup.com/updates/system-03-a-beginners-guide/
- M. Egger et al., “Evaluating the environmental impact of cleaning the North Pacific Garbage Patch”, Scientific Reports 15, 16736, 2025: https://doi.org/10.1038/s41598-025-00619-w
- L. Lebreton et al., “Evidence that the Great Pacific Garbage Patch is rapidly accumulating plastic”, Scientific Reports, 2018: https://doi.org/10.1038/s41598-018-22939-w
- European Commission, Zero Pollution Action Plan: https://environment.ec.europa.eu/strategy/zero-pollution-action-plan_en
Images:
- “Great Pacific Garbage Patch-Map-2017” by L. Lebreton, B. Slat, F. Ferrari, B. Sainte-Rose et al., licensed CC BY 4.0 (https://creativecommons.org/licenses/by/4.0), via Wikimedia Commons: https://commons.wikimedia.org/wiki/File:Great_Pacific_Garbage_Patch-Map-2017.jpg